

Following are lightly edited excerpts from Steve’s recent presentation in a Gurobi Optimization webinar. Watch the recording here.
If optimization is so powerful, why do top executives need convincing to invest in it? Well, they are constantly pitched, by internal colleagues and external advisors, to spend money in many different areas. They learn to say no to anything that isn’t focused on accomplishing their business strategy.
To define strategy and understand how it can help build a successful business case for your optimization project, we can make use of the work of Roger Martin, one of the best, most straightforward experts on strategy. He co-wrote the superb book “Playing to Win: How Strategy Really Works” with A.G. Lafley, the former CEO of Procter & Gamble. According to Martin, business strategy can be stated in a cascade of five questions.
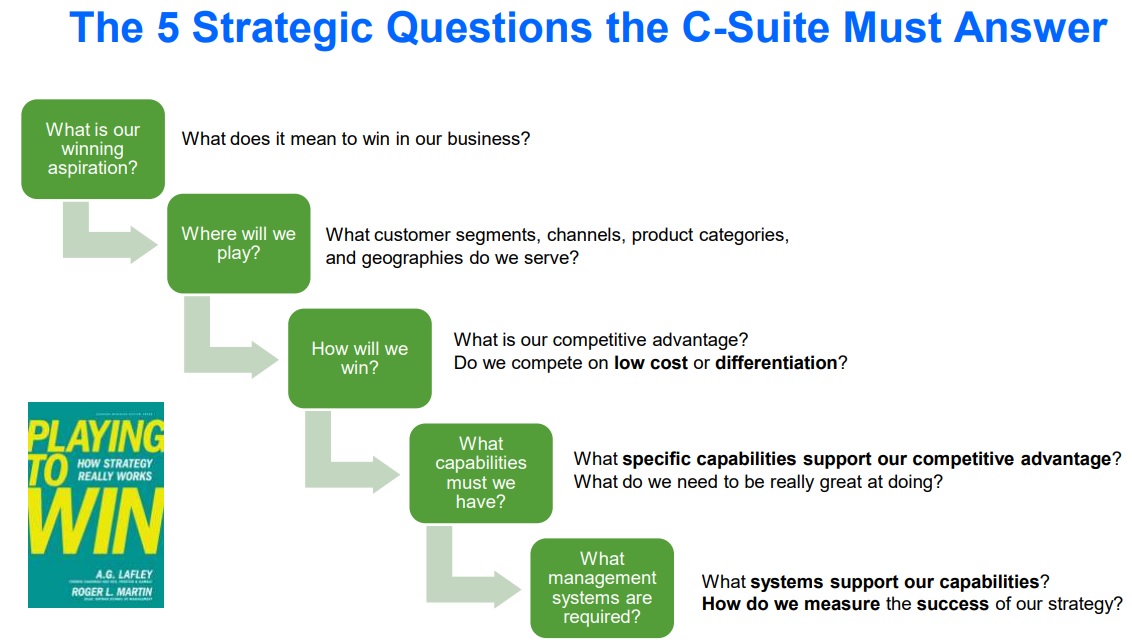
Optimization can enable strategic winning. Because building a model requires an objective function, optimization brings an excellent vocabulary to translate something that can be vague art into specific science. Optimization generates precise answers to Martin’s questions for the C-Suite, especially the last three.
Martin asserts that good strategy is about making explicit choices to increase the odds of success by insisting on a creative and rigorous approach to exploration testing, and I quite agree. That is the motivation behind presenting a formal business case for an optimization project. Here is a five‑step formula that we at Princeton Consultants believe is valuable to earn buy‑in for an optimization project from the C‑Suite.
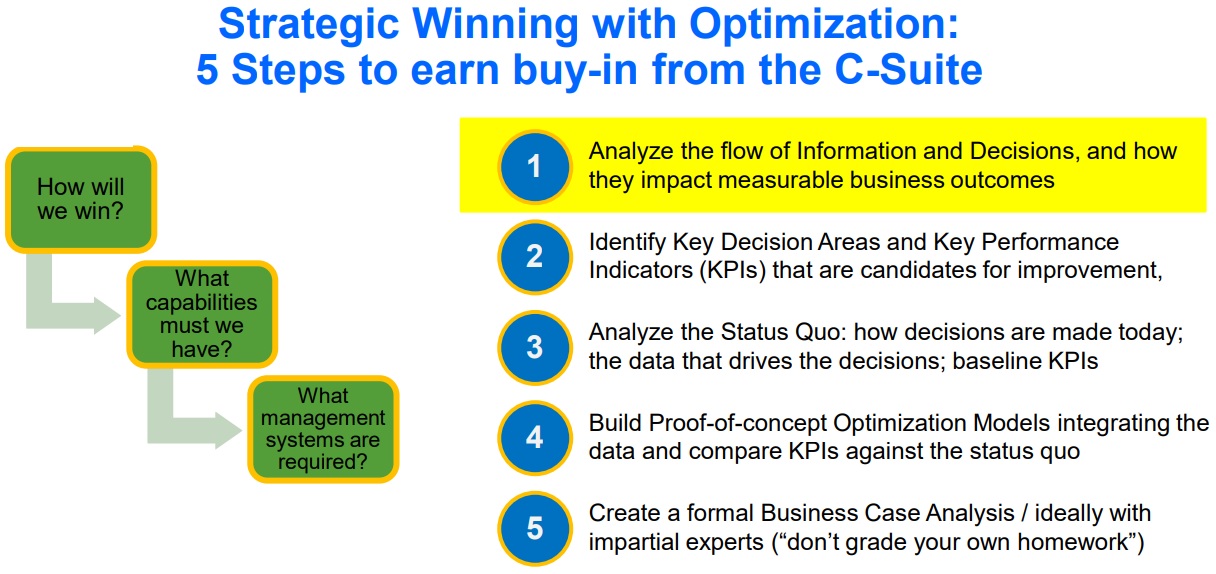
1. Start by analyzing the flow of information decisions through the organization. Don’t start with a model—instead, start with an influence diagram or an equivalent. To illustrate, I have redacted and simplified one we created for a transportation company. It is advisable to start from the top down to anchor the analysis. The rectangles represent decision blocks, and the ovals represent uncertainties.
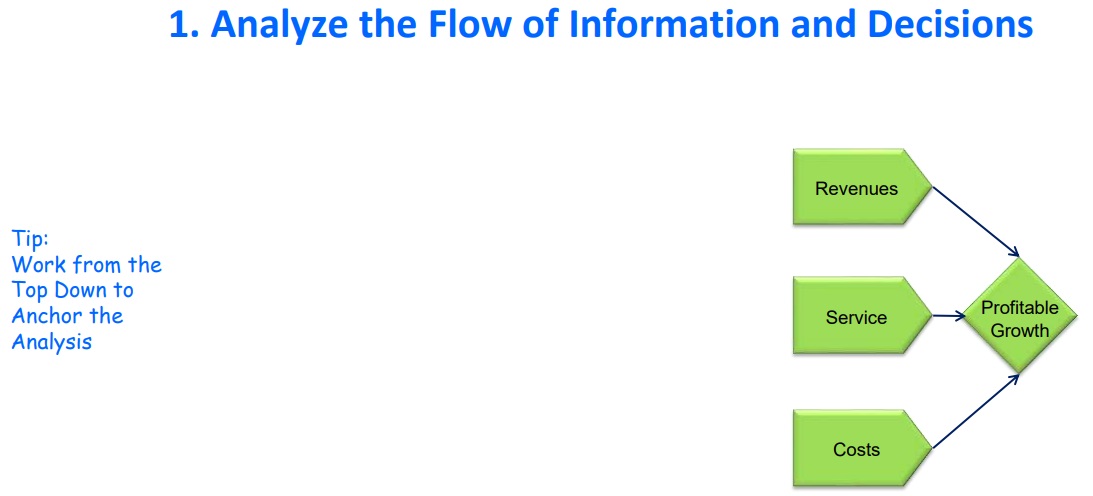
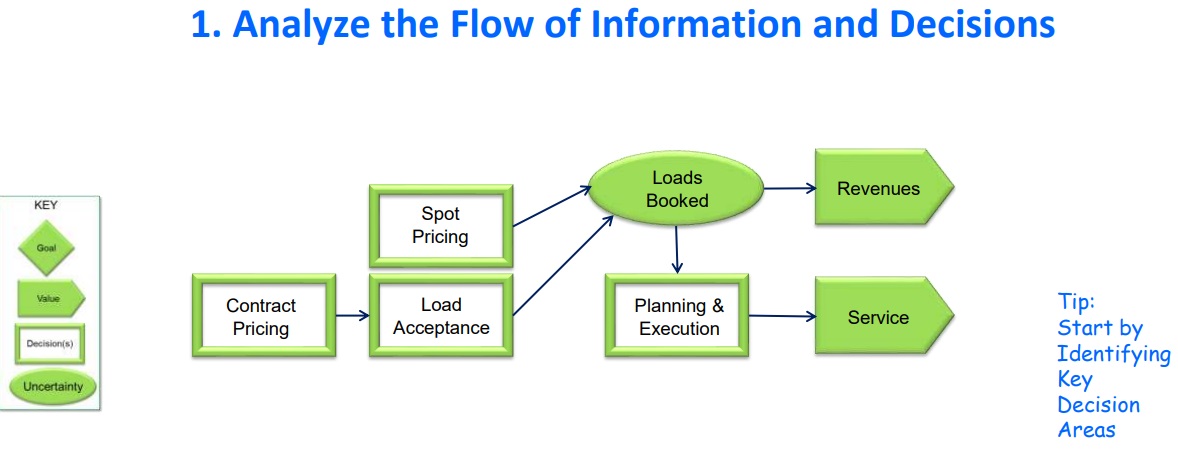
Identify the key decision areas, and understand that to a business insider, one key decision area involves many decisions. The outcome that your business is trying to achieve may not be completely under your control: you may have complete control over our own decisions, but there are other influencing factors that are impacting the decisions you’re making. The ovals in this diagram represent uncertainties. In this example, the overall customer demand and competitor actions are not under the business’s control; they are somewhat uncertain, as they may involve a purposeful obfuscation of the competitors, revealing what they are doing to their competitors. It might require forecasting. Analyze both the uncertainties and the decision‑making. Complete the entire picture if you can. Typically, there are revenues and services you are trying to maximize, and costs that you want to minimize.
In my experience, the uncertainties represent great machine learning and data science opportunities, and the decisions are great optimization opportunities. The machine learning and data science experts are terrific at saying, “Let’s get a better way to forecast which loads will get booked, competitors’ activity, and overall customer demand.” We, as optimizers, can respond, “Thanks for that information—we will help permutate the different possibilities, score each one, and recommend the best outcome.”
2. Identify key areas and KPIs that are candidates for improvement. Evaluate the status quo at your business. In the case we are examining, we choose the area called “load acceptance,” which we consider in the context of a bigger picture.
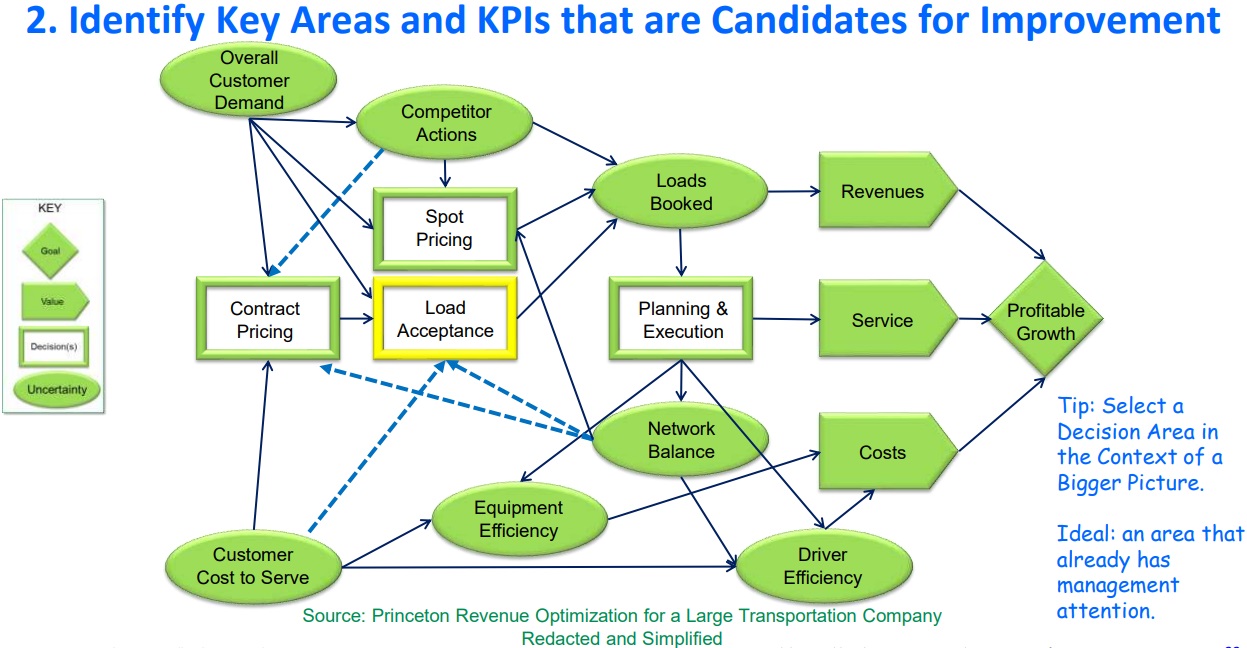
Your message to the C-Suite executive is, “Here is the area that we believe has the lowest hanging fruit, and we should dive into it first.” Ideally, this is an area that management is already focusing on. Other areas in the business may have other initiatives, or there might be skepticism about whether there is a lot of upside value in this area. State why you and your colleagues believe you want to address load acceptance, in this example, as an area where you can move the needle.
3. Collect data and model the status quo. What often looks like a very simple decision is often multi‑step and complex, as with our example of load acceptance. Redacted work product from our project team shows steps and data requirements within the “load acceptance” box.
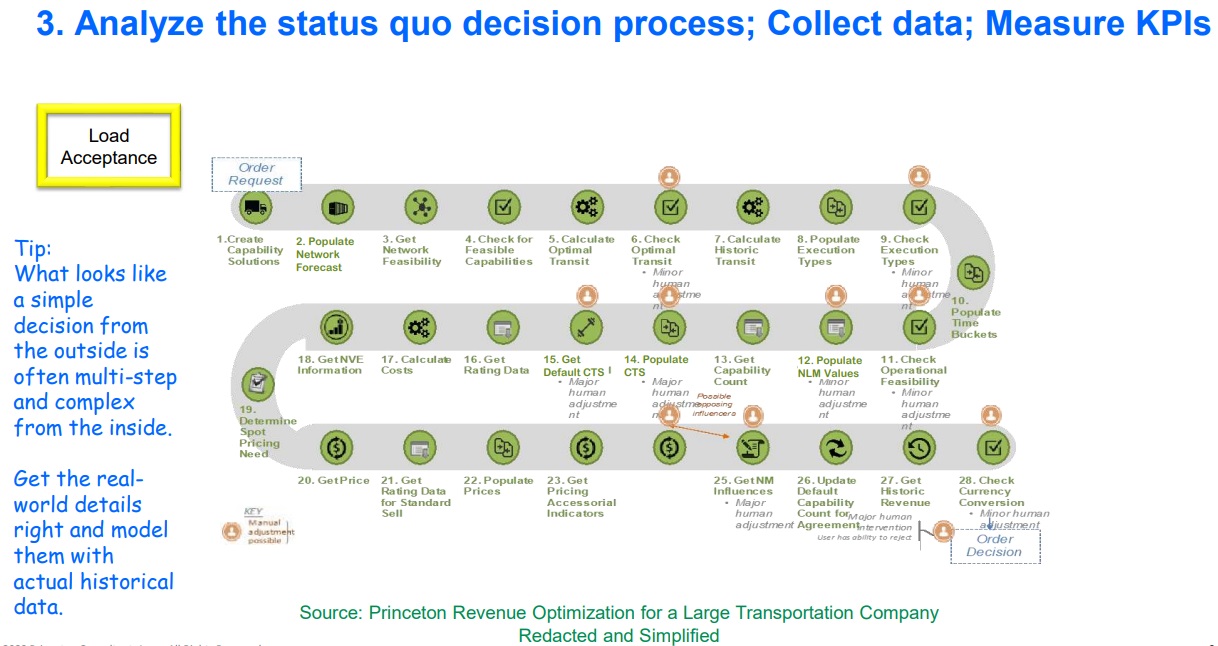
As you can see, at this company a lot goes into “load acceptance,” which demonstrates that if you are going to build a model in an area, get the details right and model the one with the actual historical data.
4. Build an optimization model and compete against the status quo.
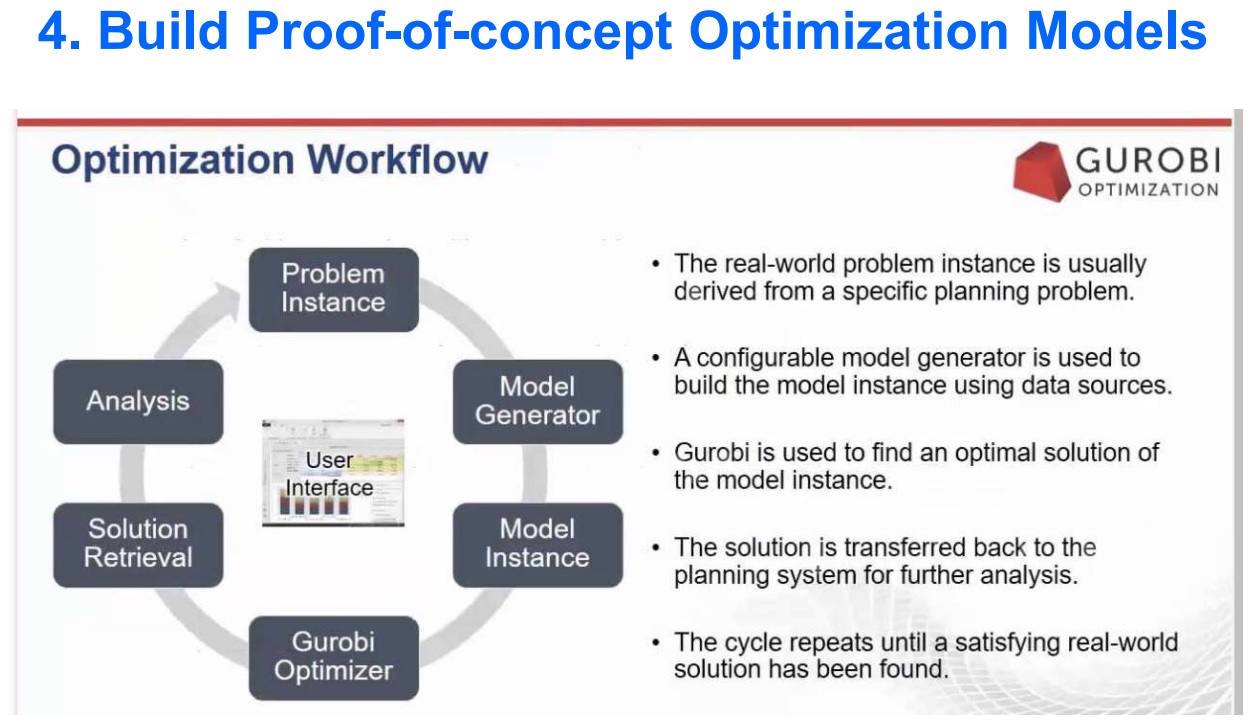
For optimizers, this is the fun part! I know a lot of the people on this call are deeply interested in this subject. Our partners at Gurobi offer many resources and can help you build these.
5. Quantify the Economic Benefits of Optimization. After you have built the model and compared it to the status quo, you must translate your win into the language of business. Create a formal business case that shows the categories of benefit, savings, and financials—providing the reasons for C-Suite executives to approve funding.
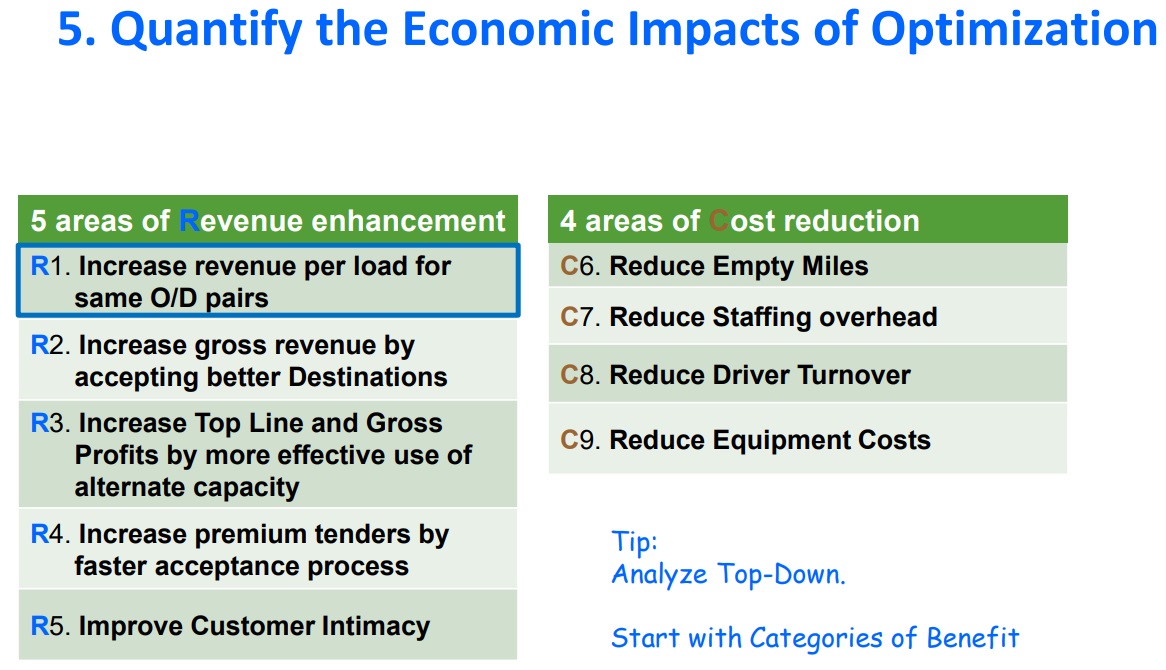
Start from the top down. Using our transportation example, I am presenting categories of improvement before we get into the pure analysis. I’m drilling down into the first area, R1. It can be helpful to list these areas so the most important, highest-impact areas are at the top. Indeed, in this example, it turned out that increasing revenue per load was the primary driver. The real presentation for this company consisted of nine major exhibits, starting with R1.
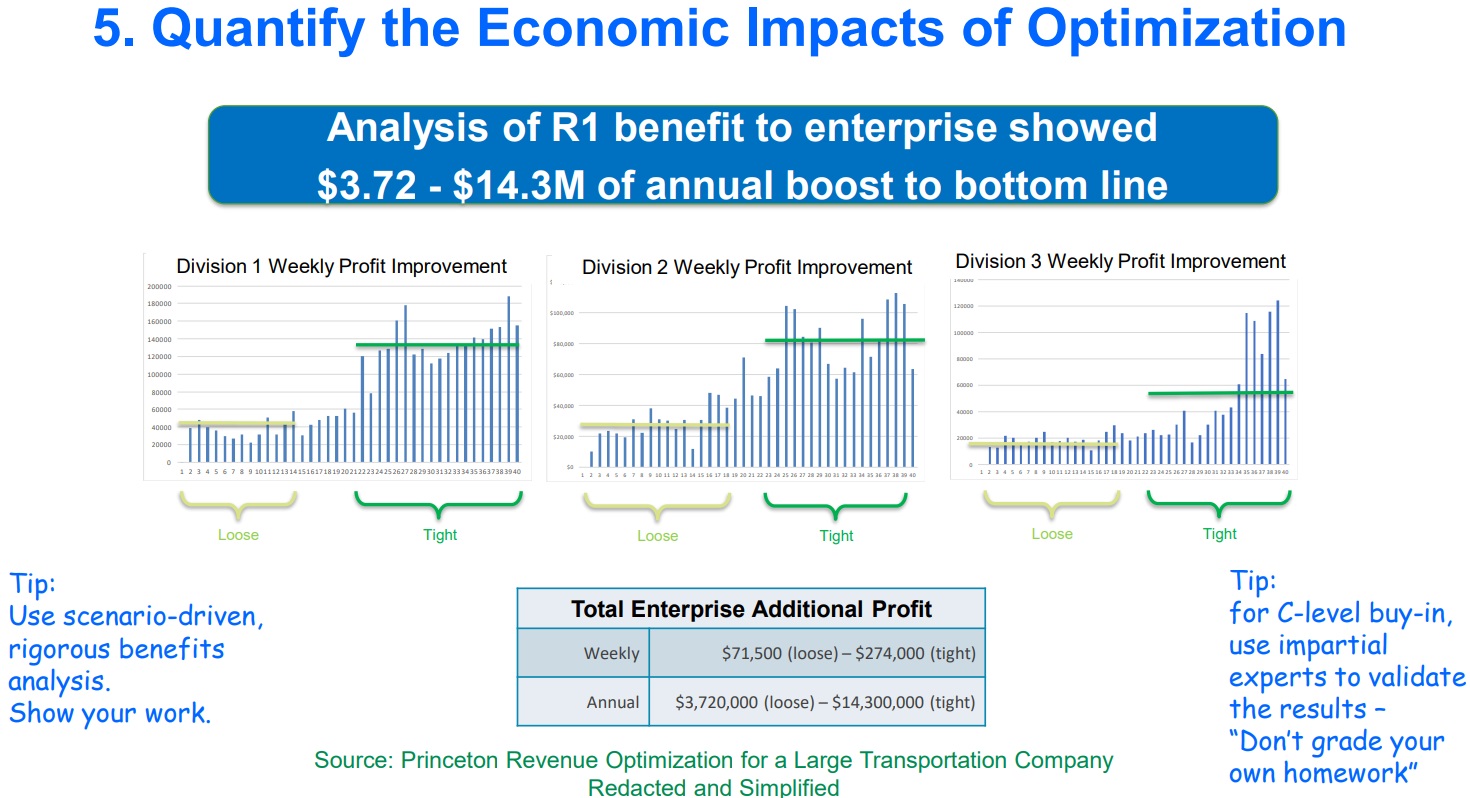
To create this exhibit, we got consensus from the finance team and the executive team. We had explained to the executives how we were going to measure the impact of the optimization model over the status quo. Although redacted, these were representative savings that we found. The blue bar shows a wide range of annual additional profit: $3 billion to $14 million a year, because at this company there is a colossal amount of variability in their business, which executives have real difficulty seeing ahead of time.
Part of the modeling required in a scenario-driven approach here are the different assumptions. The most pessimistic assumption in this example, a “loose” transportation market all year long, led to the $3 million benefit. The optimistic assumption was based on the best market condition ever seen, which led to the high end of projected savings of $14 million.
In this activity it is critical to get C-Suite buy‑in, because you need experts to validate the results. Don't grade your own homework! Your business case is built on these models, so work with impartial experts, perhaps from your Finance department, or with third-party firms like ours who will evaluate if your numbers are accurate and the analysis is done correctly.
Good luck with your work! I will always welcome a conversation if you would like more information or assistance in building a business case for your optimization project.